


A case for 2D
'Never let a crisis go to waste'

I’ve struggled to write this post over the past week. The Texas Flash Flood is too raw, and the details are too polarizing as to what might have gone wrong. I’ve seen the Monday morning quarterbacks wondering how cabins might have gotten approved at or near the floodplain, to reports that those cabins on the edge of the NFIP were inundated by over eight feet of water. There will be a proper time.
During my years in industry, one notable example I observed was the response to the 2015 floods in Australia. [I may have the wrong storm events, so apologies if the link isn’t the key to why there were changes.] There was a general shift in the engineering market in how they responded to the devastation. From my research a number of years ago, the older rainfall estimation (87) needed updating, and more emphasis was placed on 2D analysis for urban and rural catchments with a greater emphasis on the hazards associated with flooding.
The ARR 2016 also went beyond simply considering water surface elevation by incorporating a broader approach to flood hazards. It introduced updated methods for assessing flood risk, including hazard curves and the interaction of coastal and riverine flooding, as well as guidance on blockages in drainage systems. These updates emphasized a more comprehensive understanding of flood hazards, such as flow velocity, depth, and their combined impacts, which are critical for infrastructure design and floodplain management. Book 6 (Flood Hydraulics) and Book 9 (Runoff in Urban Areas) of the ARR 2016 provide detailed guidance on these aspects. (Grok)
With TUFLOW, the 2D engine can generate Flood Hazard Maps in 26 different flavors. (See TUFLOW Manual on Hazards) Examples such as the Queensland Reconstruction Manuals image shown below discuss those areas which are safe vs. unsafe for people and property.
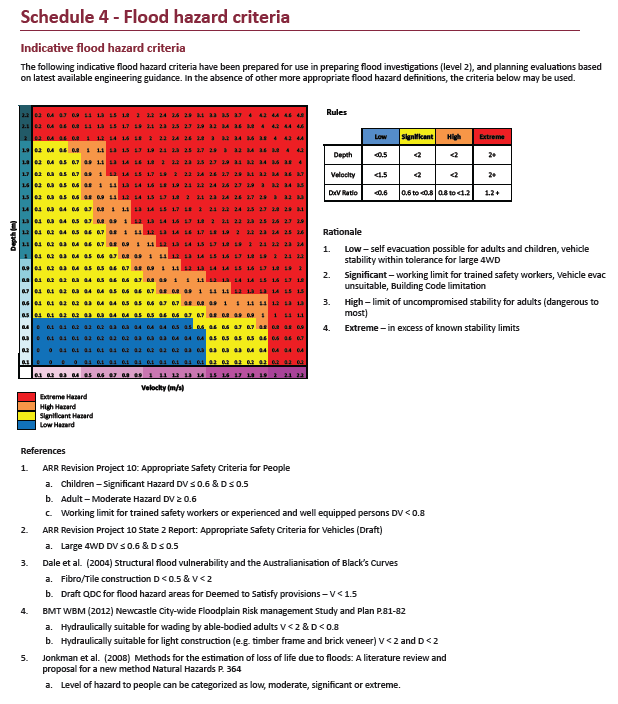
In the US, we tend to refer to the National Flood Insurance Regulation Maps as indicating whether a location is suitable for building or not, or to build at a suitably safe elevation.

Events such as the flash flooding show that our risk isn’t limited to a median event, or even the risk associated with an average watershed’s mean rainfall event. The Guadalope’s Base Level Engineering study in 2016 uses Regression Equations to define the discharge rates. The news media claim that the Texas event was a 1-in-1,000-year event. Eh…
As I discussed this with my son, the event appears more like a black swan in the form of rainfall. While the whisker plot below shows three outliers at the low end of the distribution curve, Texas appears to be outside the upper range.
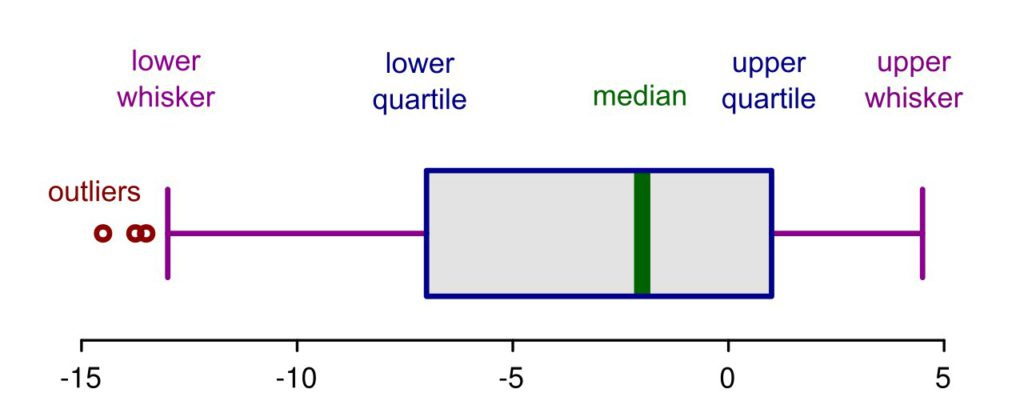
The USGS Report for Texas Regression equations discusses HIGH OUTLIERS AND HISTORICAL RECORD, and how to deal with these types of events. They do occur, but we dull our senses to the actual risk.
I’ll leave this image from that Queensland Report.

Boy Scout Motto - Be Prepared. Let’s do better.