
Critical vs. Nested
An interesting dichotomy

I started my career in the early days of the Illinois Bulletin 70 / Circular 173 implementation. This method required evaluating more storm events and a bit of analysis that only a few software vendors understood. Remember that TR-20 was a DOS program we wrote using a text editor.

Critical Duration
What is a Critical Duration storm?
A critical duration storm is the rainfall event of a specific duration that produces the maximum peak runoff or flood response for a given watershed or drainage area. It is determined by analyzing storms of various durations to identify the one that, due to its intensity and timing, causes the most severe hydrological impact, such as the highest peak flow or water level, under specific watershed conditions. This concept is often used in hydrologic design to size infrastructure like culverts, dams, or stormwater systems to handle worst-case scenarios. (xAI provided definition)
The Florida Drainage Connection handbook described the critical duration storm as follows:
A critical duration storm is the rainfall event of a specific duration that produces the maximum peak runoff or flood response for a given watershed or drainage area. It is determined by analyzing storms of various durations to identify the one that, due to its intensity and timing, causes the most severe hydrological impact, such as the highest peak flow or water level, under specific watershed conditions. This concept is often used in hydrologic design to size infrastructure like culverts, dams, or stormwater systems to handle worst-case scenarios.
Nested or Empirical Storm
The Florida Drainage Connection handbook describes the contrast between the nested storm and single design approaches. The thinking is that this nested set of intensities provides the range of intensities needed to determine conveyance rates effectively, but potentially, it is not the proper volume in the system.
This is different than all the other water management districts that use a single design storm approach. The single storm typically has a duration and distribution developed by the National Resource Conservation Service (NRCS). Some of these water management districts have modified the NRCS distributions slightly; nevertheless, all of the single storms are “nested” storms, meaning peak intensities are grouped or nested around a certain hour of the design storm. These empirical relationships do not reflect actual rainfall patterns and, subsequently, produce inaccurate representations of actual rainfall-runoff relationships. These relationships have been acceptable in the past for the design of conveyance systems because they give conservatively high runoff estimates; however, when these relationships are used to determine the pre-improved discharge rate for proposed stormwater ponds they can result in downstream flooding because they overestimate the pre-improvement runoff.
Another important consideration is system response. Different types of drainage systems fail under different types of rainfall events. More specifically, urban storm drains and collection ditches can usually accommodate events characterized by high volume, long duration, and low to moderate intensity whereas short duration, low volume, and high intensity events usually result in system overload for some period of time which is considered a failure. Conversely, large canal systems and primary creek systems will fail under high-volume, long-duration events but can usually accommodate short intense events.
Large river systems and static water systems such as lakes reach critical stages when extreme antecedent conditions exist and are generally unaffected by variations in rainfall intensity.
The latter comment makes sense if you consider how different systems respond. A small development might fail under short-duration high intensities by itself, but as part of a larger whole watershed, it might fail under the increased flooding found in high-volume, long-duration events.
As I mentioned in the Hydrology 101 webinar I conducted for XPSWMM in 2017, the Atlas 14 temporal was emerging.
They are now part of Minnesota’s workflow.
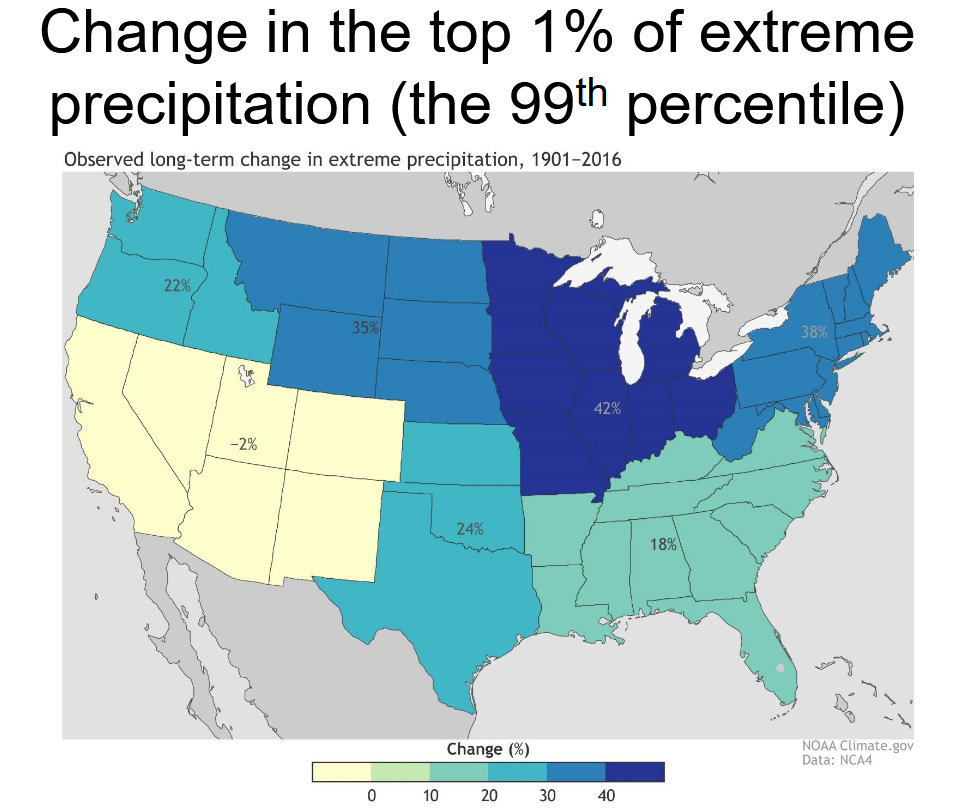
With rainfall changes being observed, I would expect rainfall to not be constant. In fact, this chart came from one of the presentations on updating Bulletin 70, which resulted in Bulletin 75 in Illinois, which updated the Huff Distritions for the Chicago area.
With Atlas 15 underway and possibly released later in 2025, be agile and open to the possibility that critical duration is coming your way.